
Key Definitions:
- Hunger: chronic undernourishment or outright starvation leading to death.
- Chronic Hunger is long term lack or shortage of food
- Periodic Hunger is short-term hunger, caused by factors such as war, natural disasters, etc.
- Malnutrition: a diet that is lacking (or having too much) in quality and quantity of food.
- Starvation: limited or non-existence of food
- Famine: Long term and severe food shortage or unavailability of food in a given area.
Global patterns in food/nutrition indicators:
1. Global Food Security Index (GFSI)
“Food security exist when all people, at all times, have access to sufficient, safe and nutritious food to meet their dietary needs and food preferences for an active and healthy life.” (FAO)
The Global Food Security Index takes into account four core issues of affordability, availability and quality of food across 113 countries. It uses 28 indicators as a benchmark and goes beyond hunger in measuring food security. GFSI includes a new category that measures a countries’ exposure to the impacts of a changing climate, susceptibility to natural resource risks and how countries are adapting to these risks.
Affordability, or the capacity to afford good-quality food without undue stress, explores the capacity of a country’s people to pay for food, including their ability to cope with food-related price shocks. Affordability is measured across six indicators:
- Food consumption as a share of household expenditure
- Proportion of the population under the global poverty line (% of population with income under US$3.10/day at 2011 purchasing power parity, or PPP, exchange rates)
- GDP per head at PPP exchange rates
- Agricultural import tariffs
- Presence of food safety-net programmes
- Access to financing for farmers
The Availability category assesses factors that influence the supply of food and the ease of access to food. Availability is measured across eight indicators:
- Sufficiency of supply
- Public expenditure on agricultural research and development (R&D)Agricultural infrastructure
- Volatility of agricultural production
- Political stability risk
- Corruption
- Urban absorption capacity
- Food loss
The Quality & Safety category moves beyond traditional welfare metrics, such as poverty and issues of access and supply, and explores the nutritional quality of average diets and the food safety environment in each country. Food quality and safety is measured across five indicators:
- Diet diversification
- Nutritional standards
- Micronutrient availability
- Protein quality
- Food safety
Source: The Economist Intelligence Unit: Global food security Index 2017 pp15

Rankings: Top five countries for 2017: Ireland – 85.6, United States – 84.6, United Kingdom – 84.2, Singapore – 84.0 and Australia – 83.3. The bottom three: Madagascar – 27.2, Congo (Dem. Rep.) – 25.5 and Burundi – 25.1
2. The Global Hunger Index


Source: The Global Hunger Index 2017
The scale below is used to measure the severity of hunger – ranging from 0 (lowest to 100(highest).

Regional Variations in the GHI since 2000.

The 2017 Global Hunger Index (GHI) indicates that worldwide levels of hunger and undernutrition have declined over the long term: At 21.8 on a scale of 100, the average GHI score for 2017 is 27 percent lower than the 2000 score (29.9). At the regional level, South Asia and Africa south of the Sahara have the highest 2017 GHI scores—30.9 and 29.4, respectively, indicating serious levels of hunger.
The GHI scores, and therefore the hunger levels, for East and Southeast Asia, the Near East and North Africa, Latin America and the Caribbean, and Eastern Europe and the Commonwealth of Independent States are considered low or moderate, ranging from 7.8 to 12.8 points (The Global Hunger Index, 2017).
Case Studies:
1. A closer look at hunger and undernutrition in Ethiopia. Click here
2. A close look at hunger and undernutrition in Bangladesh: Click here
The Global Hunger Index Results for 2018
3. Calories per person/capita
Calorie intake measures the amount of energy contained in a given amount of food. It is measured in kilocalories per person per day (kcal/person/day).
High calorie intake is associated with developed countries, and vice versa. High calorie intake is also associated with obesity and its associated problems and low calorie intake cause malnutrition or undernutrition (marasmus, beriberi, kwashiorkor). The map below shows the global distribution of calorie intake. You can visit Chartsbin and hoover your pointer on a given country to know the average calorie intake.

www.chartsbin.com
- World average calorie intake: 2780 kcal/person/day
- Developed countries: 3420 kcal/person/day
- Developing world: 2630 kcal/person/day
- Sub-Saharan Africa: 2240 kcal/person/day
- Central Africa: 1820 kcal/person/day
Strengths of calorie intake as a measure of nutrition
- It gives an overall picture of the level of development in terms of food production ie. countries with high calorie intake would usually have an advanced agricultural system. eg. in the EU where 2% of the population is engaged in agriculture and yet they are able to produce to feed the population of over 800m and export the rest.
- It is a good indicator of other indicators of development like access to safe drinking water, infant mortality, the level of technological advancement, life expectancy etc.
- It is an easy measure of a country’s state of nutrition.
- It also indicates the dietary habits of citizens in the country.
- Data can be used for comparison with other countries/regions/localities to show the extent to which they are achieving the MDGs.
Weaknesses
- It is not a sufficient measure of a country’s state of nutrition; other factors must be combined with calorie intake to give a balanced picture of the country’s level of nutrition and they include the level of education, GNI (Gross National Income) and many others.
- The data obtained may not give an idea of the regional variations that may exist in the country.
- Variations in weather conditions may cause variations in calorie intake at different times of the year.
4. Indicators of malnutrition

Malnutrition is a dietary condition caused by a deficiency or excess of one or more essential nutrients in the diet. It is characterized by extreme weight loss, stunted growth, weakened resistance to infection, and impairment of intellect. It results in body weakness and reduces people’s capacity to work. It is also noted to reduce the body’s ability to withstand diseases. Severe cases of malnutrition can lead to death. The two most common forms of malnutrition are marasmus and kwashiorkor. The indicators of malnutrition include:
a. Stunted growth
Stunting is the impaired growth and development that children experience from poor nutrition, repeated infection, and inadequate psychosocial stimulation (WHO).
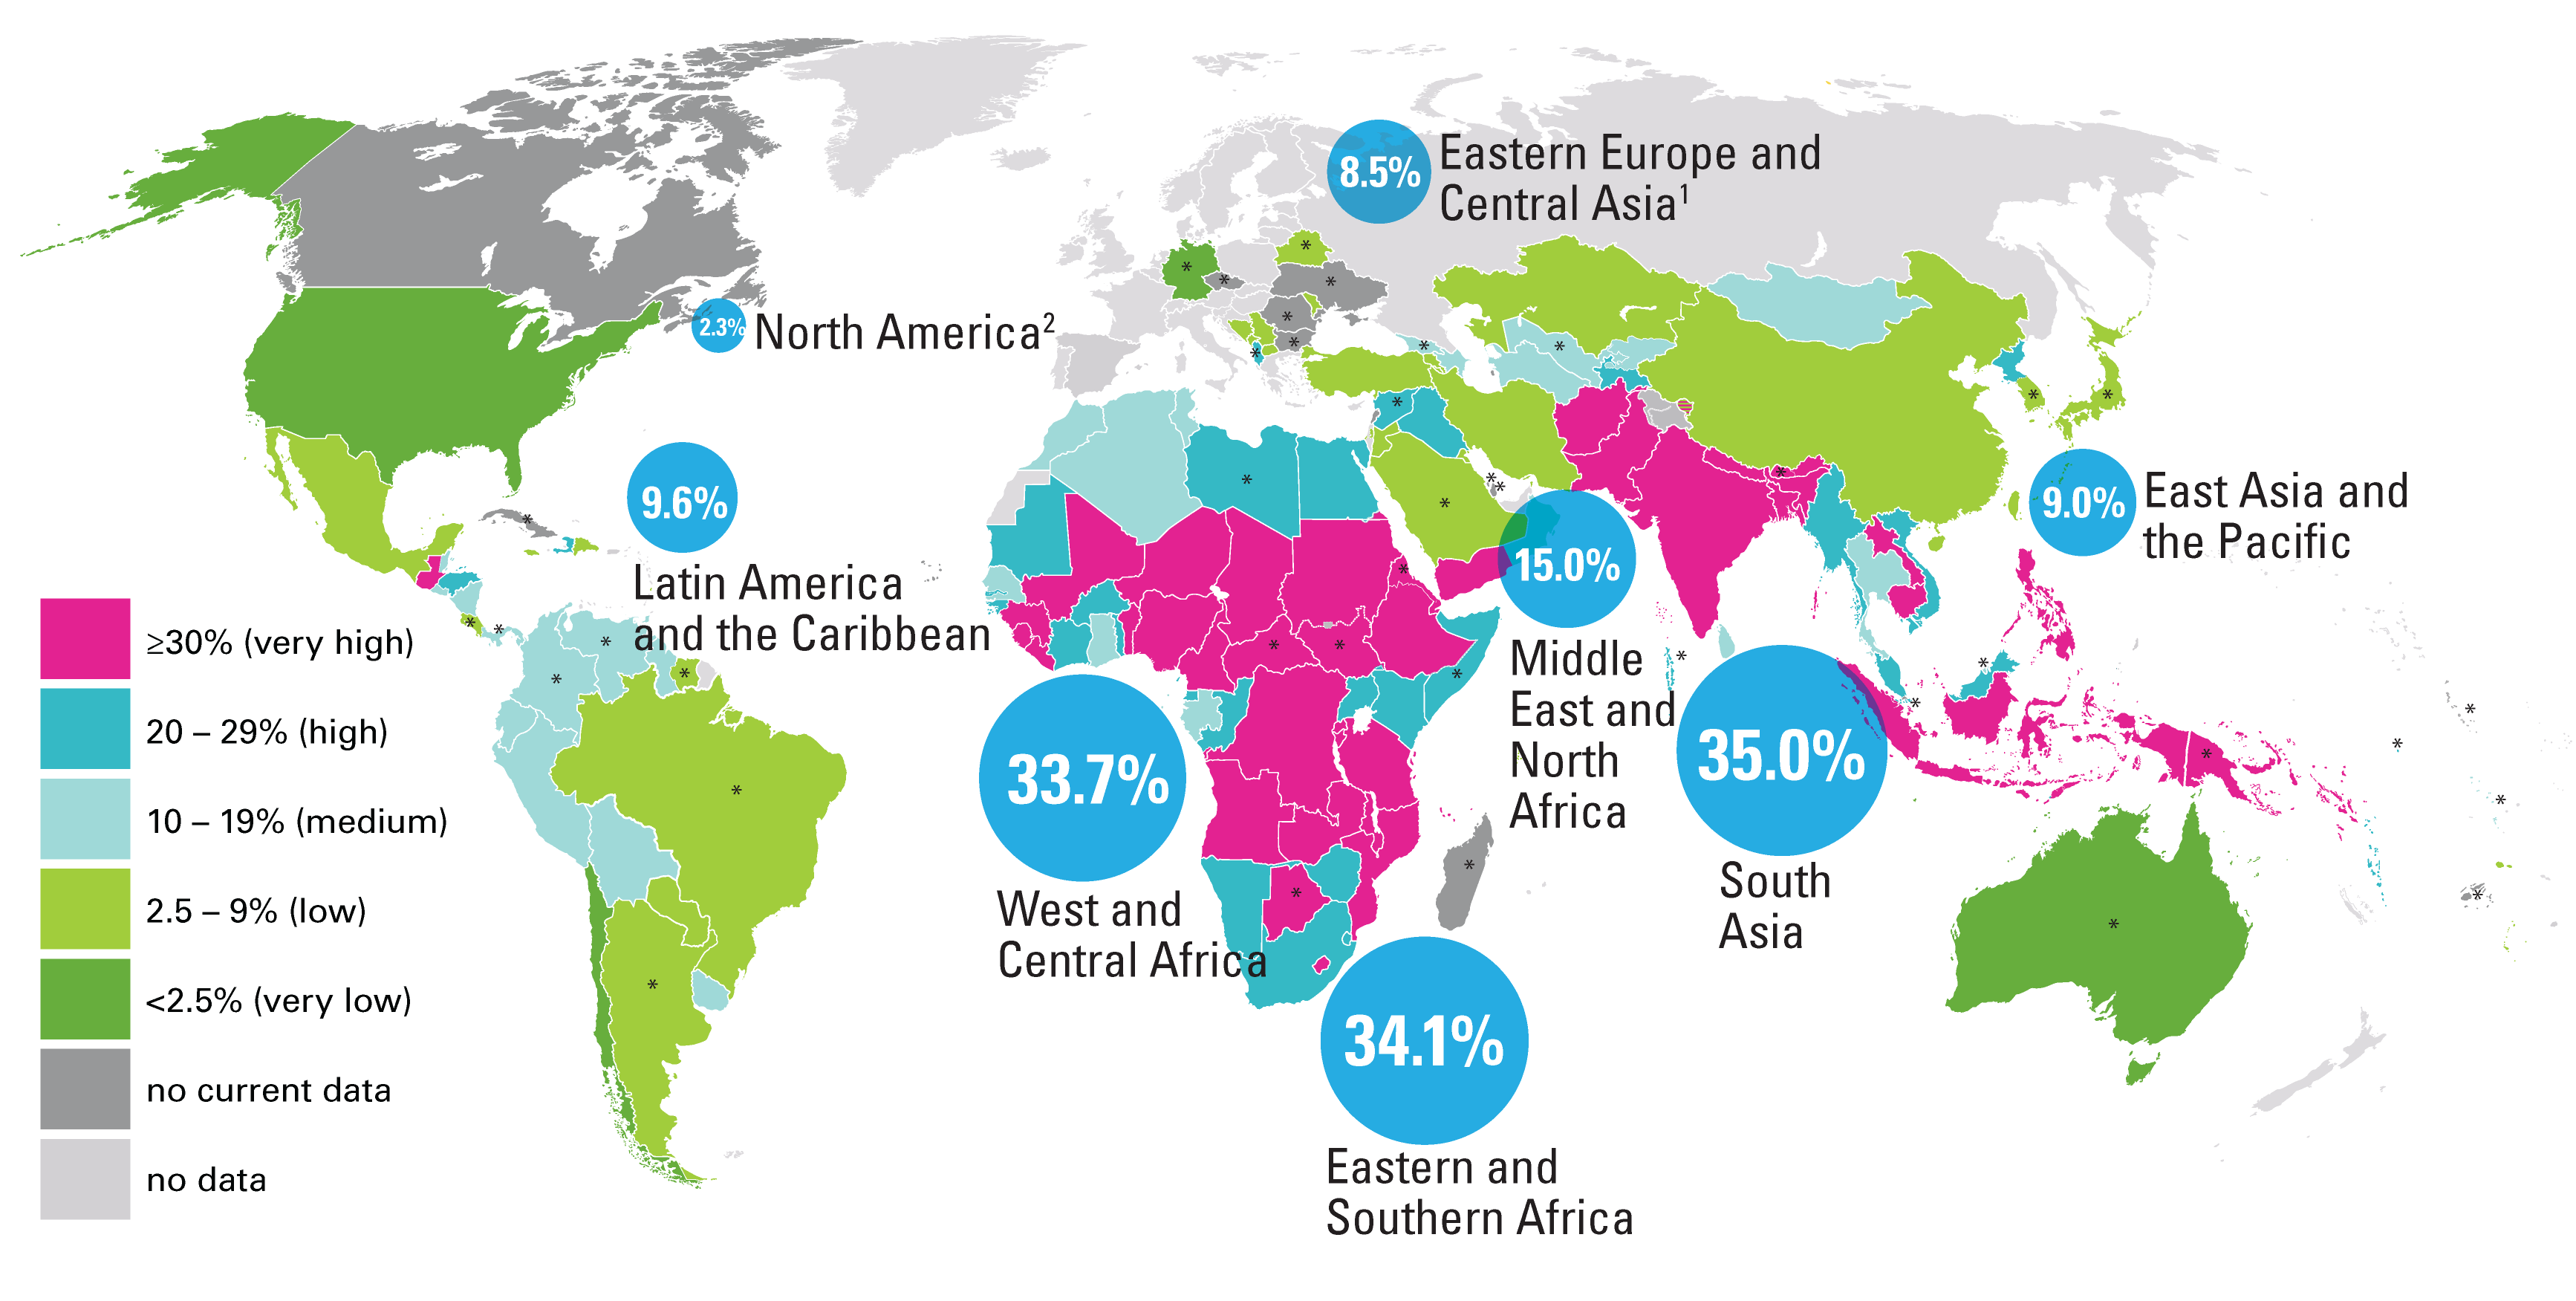
In 2017, 22.2 per cent, or just under one in four children under age 5 worldwide had stunted growth. That said, overall trends are positive. In 2017, nearly two out of five stunted children lived in South Asia while more than one in three lived in sub-Saharan Africa (UNICEF).
Child stunting can happen in the first 1000 days after conception and is related to many factors, including socioeconomic status, dietary intake, infections, maternal nutritional status, infectious diseases, micronutrient deficiencies and the environment(WHO)
Source: UNICEF, WHO, World Bank Joint Child Malnutrition dataset, May 2018
Visit WHO YouTube channel for lessons 1-4 on stunted growth
b. Wasting
Wasting refers to low weight-for-height where a child is thin for his/her height but not necessarily short. Also known as acute malnutrition, this carries an immediate increased risk of morbidity and mortality. Wasted children have a 5-20 times higher risk of dying from common diseases like diarrhoea or pneumonia than normally nourished children (Motherchildnutrition.org).
In 2015, South Sudan experienced the highest prevalence of wasting, with 22.7 percent of under-5s defined as wasted. The prevalence of wasting is typically highest across Sub-Saharan Africa and South Asia, with countries such as India, Sri Lanka, Djibouti, Sudan and Niger recording some of the highest levels (greater than 15 percent).
Facts:
- Globally, 50.5 million under-five-year-olds were wasted (or low weight for height) in 2017 (UNICEF, WHO, & The World Bank, 2018).
- Globally, wasting prevalence in 2017 was estimated at almost 8 percent (UNICEF, WHO, & The World Bank, 2018).
- Approximately two-thirds of all wasted children under five years old lived in Asia and over one-quarter in Africa, with similar proportions for severely wasted children (UNICEF, WHO, & The World Bank, 2018).

SOurce: Ourworldindata.com
c. Undernourishment
Undernourishment is ‘a state, lasting for at least one year, of inability to acquire enough food, defined as a level of food intake insufficient to meet dietary energy requirements’ (FAO,2013).
Undernourishment, or the incidence of being underweight for age, can include children who are stunted, wasted or suffering from insufficient energy intake over a longer period of time. It is a measure of the share of the population that consumes an amount of calories that is insufficient to cover the energy requirement for an active and healthy life (as defined by the minimum dietary energy requirement). (FAO,2013)

In the FAO report, ‘hunger’ is synonymous with ‘chronic undernourishment’. The consequence of undernourishment is called Undernutrition. And the FAO names four outcomes of undernourishment, and/or poor absorption and/or poor biological use of nutrients consumed as a result of repeated infectious disease (Ourworldindata.org). These are:
- Being underweight for one’s age.
- Underweight is defined as ‘low weight for age in children, and BMI of less than 18.5 in adults’. (Ourworldindata.org)
- For children, two consequences of undernourishment are:
- being ‘too short for one’s age’ which is called stunting,
- being ‘dangerously thin for one’s height’ which is called wasting,
- and being ‘deficient in vitamins and minerals’ which is called ‘micronutrient malnutrition‘.
The Nutrition Transition, and associated regional variations of food consumption and nutrition choices

The nutrition transition is the dynamic shift in dietary consumption associated with changes in demographic transition and its consequent epidemiological changes. In other words, it refers to changes in dietary patterns and their related diseases, as countries progress from hunger-gatherer to modern societies ( i.e from stages 1 to 4 of the demographic transition model).
Nutrition transition can be classified into five patterns:
- Pattern 1 Hunter Gatherer: hunter-gatherer society, where the diet is primarily high in carbohydrates and low in fat. People are highly active and they suffer from the disease of poverty and other common diseases. Obesity is rare in such societies.
- Pattern 2 Early Agriculture: characterized by famine and foods mostly cereals. This coincides with stage 1 of the demographic transition model.
- Pattern 3 End of Famine: reduced famine, and fruits, vegetables and animal protein in the diet. Also, characterized by falling birth-death rates
- Pattern 4 Overeating, Obesity-Related Diseases: People have access to a lot of high-calorie foods, and they become less active, leading to increases in obesity and obesity-related chronic diseases, such as diabetes and heart disease.
- Pattern 5 Behavior Change: individuals change their behavior and communities in response to obesity-related chronic diseases leading to lifestyle changes, such as walking to prevent these conditions.
Click here for further details on nutrition transition patterns
Patterns 1 to 3 are typical of low-income countries, now transitioning to pattern 4, where they are beginning to consume more energy diets and consequently the development of diseases associated with high-income countries. It is the shift from stages 1, 2 and 3 to stage 4 that is referred to as nutrition transition (in terms of the changes in food patterns). The diagram below gives a summary of the five patterns:

Watch this YouTube video for case studies of nutrition transition in Mali and Nicaragua.
![[A4]Obesity-vs-Hunger](https://yambilla.files.wordpress.com/2018/10/a4obesity-vs-hunger.jpg)
Global patterns in health indicators:
1. Health-adjusted life expectancy (HALE)
HALE is a measure of population health that takes into account mortality and morbidity. It adjusts overall life expectancy by the amount of time lived in less than perfect health (healthknowledge). It is the equivalent number of years in full health that a newborn can expect to live, based on current rates of ill health and mortality. LE and HALE generally increase with the level of education. However the difference between life expectancy and HALE reduces as the level of education rises. Hence those with low levels of education tend to have lower LE and vice versa.
Strengths
- it measures both the quality and quantity of life
- Unlike life expectancy which considers all years to be equal, HALE weights the years of life by health status.
- It is useful as it helps to know the specific group of people in a given population living with a disease.
Weaknesses
- Lack of reliable data on mortality and morbidity. Morbidity is “a term used to describe the rate of disease in a population or a focus on death.” eg. the number of people who have cancer.”
- The data obtained is difficult to compare with data from other health interviews.
- The fact that women live longer than men does not always mean those additional years are associated with good health. Hence, HALE is not an effective indicator of the state of health.
- It doesn’t measure the disability years of a person. Consequently, a new measure to cater for this weakness is the Disability Adjusted Life Year (DALY).
2. Infant mortality Rate (IMR)
It refers to the number of children who die before their first birthday per 1000 live births. It also gives a good indication of the level of maternal health. It is lower in countries with higher HDI than in countries with lower HDI. Sub-Saharan Africa has the highest IMR in the world. In 2017, 4.1 million (75% of all under-five deaths) occurred within the first year.
Globally, the infant mortality rate has decreased from an estimated rate of 65 deaths per 1000 live births in 1990 to 29 deaths per 1000 live births in 2017. Annual infant deaths have declined from 8.8 million in 1990 to 4.1 million in 2017. IMR in Sub-Saharan Africa is about 51 per 1000 live births, compared with 8 per 1000 live births in European countries (WHO)

Calculation of IMR: IMR= (total no. of deaths of children < 1 year old x1000 per yr)/total no. of live births
Strengths:
- It gives an indication of the level of female education in a country.
- It gives an indication of the level of healthcare delivery in a country.
- it is also an indication of the level of sanitation, nutrition and housing in a country.
Weaknesses:
- It only gives an indication of child mortality when they are below one. However, the death of children above one year is not represented.
- it does not give an indication of the overall care system in a country.
- it does not give an indication of the cause of the death of the infant.
3. Maternal mortality
The World Health Organization (WHO) defines maternal death as “the death of a woman while pregnant or within 42 days of termination of pregnancy, irrespective of the duration and site of the pregnancy, from any cause related to or aggravated by the pregnancy or its management but not from accidental or incidental causes”.
Maternal mortality rate (MMR): the number of maternal deaths in a population x 1,000 women number of women of reproductive age
Strengths:
Weaknesses
4. Access to sanitation
This can be used as a yardstick for measuring the health of a population this is because access to safe drinking water can prevent certain waterborne diseases such as bilharzia, cholera and guinea worm.
Advantages
- It can give an indication of the extent of the waterborne diseases affecting the people
- Gives an indication of the level of infant mortality in the country.
- Indicates the level of economic development of an economy
- Data obtained can be used for comparison purposes either at the national level or the local level
- It helps policymakers to make decisions as to what facilities to provide in specific areas.
Disadvantages
- The data obtained may not give an idea of the regional variations that may exist in the country.
5. The ratio between doctors/physicians and people
Access to healthcare services includes the means of delivery, type of medical personnel, and availability of medical facilities or infrastructure eg. Clinics, mobile hospitals, nurse and doctors training colleges. This can be measured by using the doctor-to-patient ratio.
Advantages.
- It tells us about the health delivery system in the country.
- It indicates the level of infrastructural development in terms of medical facilities including road networks, access to remote areas, ambulance service, internet services e.t.c
Disadvantages
- It doesn’t give an indication of the quality of healthcare delivery; rather, it indicates the quantity of the healthcare system. It doesn’t look at other factors involved in measuring health. These include infant mortality, maternal mortality, calorie intake etc.
The Epidemiological Transition
Epidemiological transition is the shift in disease patterns that reflect the changes in the nutrition transition. The dual burden of disease refers to the shift in disease patterns in low-income countries from communicable (cholera and tuberculosis) to non–communicable diseases (cardiovascular disease, cancer and obesity).
As low income countries begin to improve their standards of living, they tend to adopt western lifestyles that result in changes in their dietary habits and consequently the spread of degenerative or non-communicable diseases. The main causes of such changes are globalization, global mass media, global agriculture policies as well as urbanization.

Epidemiological transition is now spreading worldwide
India’s escalating burden of non-communicable diseases
The diseases continuum (diseases of poverty to diseases of affluence)
Diseases of poverty are medical conditions found among poor people in LICs. The global distribution is related to economic and social development, though pockets of diseases of poverty can also exist in developed nations.
Examples include many communicable (infectious) and parasitic diseases, as well as diseases related to vitamin and/or calorie deficiencies. They are malaria, AIDS, measles, pneumonia, kwashiokor, tuberculosis, leprosy, sleeping sickness, bilharzia, river blindness, diarrhoea, yellow fever etc.
Factors include:
- lack of access to adequate medical care because of costs and/or poor availability;
- poor quality of water supply;
- high levels of environmental pollution;
- poor levels of sanitation.
- poor nutrition
- lack of information and illiteracy among women
On the other hand, diseases of affluence are medical conditions that are associated with wealth or affluence. These degenerative diseases are associated with different lifestyles and/or increased overall life expectancy, typical of wealthy societies. They include coronary heart disease, cancer, asthma, type 2 diabetes, peripheral vascular disease, obesity, hypertension, and some allergies.
Questions:
- Using examples of diseases, distinguish between diseases of affluence and diseases of poverty. [6 marks]
- Explain the global distribution of diseases of poverty. [6 marks]
The implications of a global ageing population for disease burden
Globally, life expectancy is increasing and many people are beginning to live longer than 65 years than ever before. As LICs improve their economies, they tend to develop lifestyles of HICs, resulting in the prevalence of diseases of affluence and less of the disease of poverty. This has consequences on the health system in both HICs and LICs. It implies that many governments would begin spending more on healthcare systems that focus more on catering for the elderly than those that cater for the needs of the younger generation.
It is estimated that by 2030, non-communicable diseases will represent half of the disease burden in LICs, with less of communicable diseases. The disease burden would cause an increase in spending on medical health care in both HICs and LICs.

